They’re available at Amazon, follow this link.

The softcover is $19.99. The Kindle edition is $9.99.
Answers to fantasy baseball questions (and much more) since 1996

They’re available at Amazon, follow this link.
The softcover is $19.99. The Kindle edition is $9.99.

For 17 years I’ve played with a bunch of friends in a quirky keeper 5×5 (OBP) fantasy league called the XFL. We hold a $260 auction in the fall at First Pitch Arizona, keeping up to 15 players off the previous year’s rosters with a $5 increase (+$3 for players picked up before they had ML playing time). Then, in March, usually, we have a 17-round supplemental draft to round out our 40-man rosters.
Only this year, you know, we didn’t have that supplemental. We first put it off until April 20, and then as that date approached we collectively realized that it made no sense to spend time on something when conditions in the majors this year may be totally different, or that there may not even be a this year, so we postponed.
Which led to the idea of doing something. Anything. What that turned out to be, under the direction of Ron Shandler, was a draft of the major league players from 1982. I’m not sure why Ron chose ’82. I pushed for 1980, since that was the first year of our game and Dan Okrent’s piece about the Rotisserie League the following winter in Inside Sports magazine was called “The Year George Foster Wasn’t Worth $36.” But 1982 was fine, it was the first year I played the game, joining the Stardust League that Matthew Berry wrote about recently, in its second year.
There are things about a retrospective draft that are different than they are in a prospective draft. Our regular drafts and auctions before the season is played are shaped by our expectations–our projections–of what players may do, what chances there are that they will do more, or less, and how we put a price on that range of outcomes.
In a retro draft you know what a player has actually done, and you know the context in which he did it. That makes it fairly easy to come up with a value for each player and a ranking of player values. But it turns out that the math only gets you so far. Here’s why.
The Split: Many years ago, in the early ’90s, Les Leopold and I developed the idea that each player actually had two prices. One was his actual worth in the fantasy season just played (that’s his retro price), and his draft price, which was based on his projection and market expectations, what I call in The Guide The Big Price. We theorized that in a retrospective auction you would allocate 50 percent of your budget to pitching and 50 percent to hitting. This was something I tried to test for a long time, but there wasn’t much interest until everyone had to stay at home for months on end.
But alas, in preparing for this retro draft, it quickly became clear to me that allocating 50 percent to pitching didn’t solve all the problems. The one problem it did solve is that of pitcher injuries and unreliability, which are one and the same for the most part. Pitchers who stay healthy are reliable, but pitchers get hurt a lot. So while we discount pitching in our draft price, splitting our budgets about 65/35, spending half on pitching for half the points seemed like a good strategy.
But if you do that, I soon realized, you’re going to have to compete in all five pitching categories, and if you do that you’re going to bump into the fact that in a draft you can’t really load up your staff with aces. If you have the first pick and take Steve Carlton by the time you pick again all the other high strikeout, high wins starters will be gone. Drafts, obviously, are different than auctions, so once again we’re not testing the split.
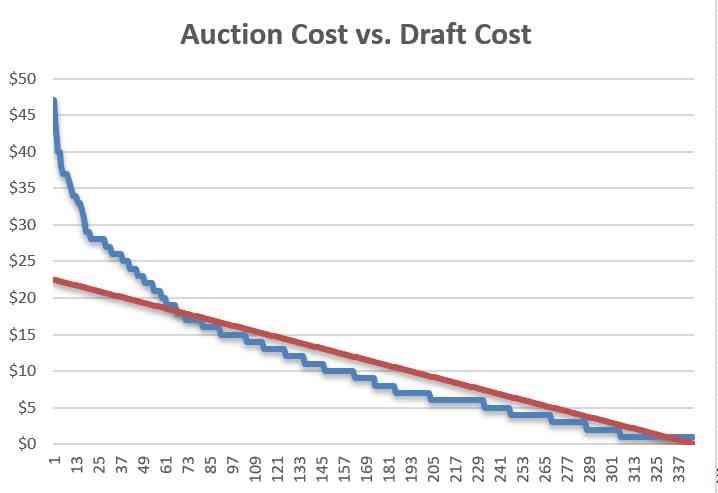
Dumping: A draft is a linear playing field. The difference between the price of each successive pick is the same. But the value of the player pool is not the same. So, when you graph, say, the auction prices in a mixed league and compare it to the line of selections in a similarly configured mixed draft, you’ll see that the value of the first 50 or so picks is higher than the line, while after the third round most picks are under the line.
I prepared by running the available players through my pricing spreadsheet, adjusting for a 12 team mixed league. Absolute prices weren’t important for this exercise, it was a draft, but I tried to jigger the balance between the categories so that I didn’t overvalue low-ERA low-production pitchers. The danger of doing that is because you’re (I) using computed prices for the player’s season. When we’re ranking players prospectively, we don’t price their optimal performance but rather one that’s in the middle of the range of possibilities. Drafting retroactively, you know what Joe Niekro’s optimal performance was worth, but if the value of his ERA and Ratio outstrip Steve Carlton’s monster strikeouts and wins in your formula, are you putting together a roster that can win?
Maybe.
As it turns out, Brian Feldman (fantasybaseballauctioneer.com) led off with Carlton as the first pick. I had the wheel and took Andre Dawson with the 12th pick and Joaquin “Donde Esta Mi Cabeza” Andujar for some reason. Niekro was still there, higher on my sheet, but at that point my sheet was too big, too many columns, and I misread hits allowed for strikeouts in Andujar’s case and typed his name into the sheet. It was fine, they were close enough, but I had already deviated from my pricing.
At the next turn I took Dave Winfield and Goose Gossage, creating my own mini Yankees run which also set off a closer run. But I didn’t really mean to turn this into a play by play. There are a few other points about this exercise.
If you love baseball and play fantasy baseball this is potentially a great way to get together virtually with friends and spend some hours with a new way to play and talk about baseball. Some of us played fantasy baseball in 1982, some of us weren’t even born in 1982, but we all knew how great Robin Yount’s season was, how bad George Foster’s was. There was lots to talk about while selecting teams.
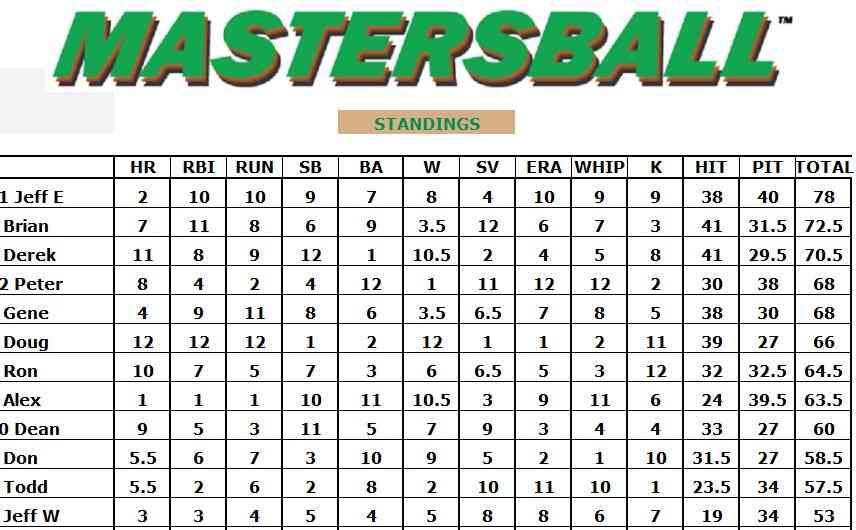
Zoom allowed us to see the excellent drafting spreadsheet that is part of the Mastersball.com package. A handful of us were also on camera, though the demands of keeping up with our lists meant we weren’t watching each other. The rest were on audio feeds, which was filled with banter and reminiscing.
The spreadsheet updated after each pick with revised standings, but we didn’t start checking that (Todd Zola was updating the sheet and he’d have to be asked to show that page) until more than halfway through. If I’d been paying attention to it earlier I would have seen that by not taking Ricky or Timmy or Willie my pursuit of steals was doomed, which would have changed some of my later picks as I vainly pursued the bottom of the steals pack and failed. This came to a head fairly deep in the draft when I selected Dickie Thon’s 37 saves and didn’t make a dent.
Position scarcity is something I didn’t think about in advance and though I was in the lead for a number of the first 20 rounds my team faded at the end. I don’t think that was caused by scarcity because when you know everyone’s value the math tells you the tradeoffs. If you take Gary Carter in the third you’re getting fewer stats than if you take Gary Ward, do you get that back later? You might, but that’s not a sure thing. A properly formed price list would have the exact 168 hitters with the positions necessary to fill 12 team rosters and prices rejiggered to reflect the fact that some of those catchers are of negative value when you price all players. They’re not negative valued when you have to pay for them, the prices have to change.
In the end, Jeff Erickson pulled out to a good lead in the last round, optimizing his categories. I failed at optimizing, wasting value by buying too much average, wasting money on steals, and having too low an ERA and WHIP. We’ll be playing again in a couple of weeks, Jeff picked the 1990 season, and you can be sure we’ll all be paying more attention, not necessarily balancing the categories, but more effectively managing the categories we dump. Or not.
Click here for the draft results.
Is your fantasy baseball draft coming up? Are you not ready? Or would you like to see what lists Alex Patton and Rotoman (FSWA Hall of Famers) are using this year? No matter what you need, they are here to help.
We’ve extracted all the ranked position charts from the PattonandCo.com annual subscriber package (which we’ve been selling for 20 years and you can buy here) and made Fantasy Baseball Cheat Sheets based on Alex’s 4×4 and Rotoman’s 5×5 lists for AL, NL and Mixed leagues.
These lists are great for reviewing your own opinions, or as the basis for your auction/draft itself. These are the Cheat Sheets Alex and Rotoman will be taking to their own AL and NL only auctions this week and next.
Yesterday I posted lists of the Top 20 hitters and pitchers in 2017, sorted by the Most Costly (with 2017 earnings), and the Most Earned (with 2017 prices).
Today I’m dumping the whole spreadsheets, sorted right now by Biggest Profit to Biggest Loss.
The most profitable hitters so far this year are:
Aaron Judge
Jeff Zimmerman
Justin Smoak
Cody Bellinger
Corey Dickerson
Avisail Garcia
Mark Reynolds
Logan Morrison
Marwin Gonzalez
Ben Gamel
Chris Taylor
Michael Taylor
Trey Mancini
Chris Owings
Andrelton Simmons
Aaron Hicks
Tim Beckham
Travis Shaw
Tommy Pham
Whit Merrifield
The Top Losers? From worst to less worst…
Starling Marte
Josh Donaldson
Manny Machado
Kyle Schwarber
Carlos Gonzalez
Leonys Martin
Ryan Braun
Marcus Semien
Miguel Cabrera
Greg Bird
That’s enough, right? These are guys someone paid real money for, and the results have not been good.
If you want the whole hitter list, download it here.
Another way to look at the pitching pool is to see what the top earners are earning, and just how much they cost on auction day.
The ratio of cost to earnings in this group reverses. The Top 20 players cost $313 and earn $596.
The biggest earner, Max Scherzer, was the third most costly pitcher, while Clayton Kershaw, also on this list was the most costly by a lot, but the big differences are the guys nobody expected so see here. Jason Vargas, Ervin Santana, Alex Wood, Ivan Nova!?!?!? No bigger surprise comes in at No. 20 on the list, Chase Anderson, who was not even bought by the experts on draft day.
Here’s the whole list of biggest 2017 earners so far (click to enlarge):


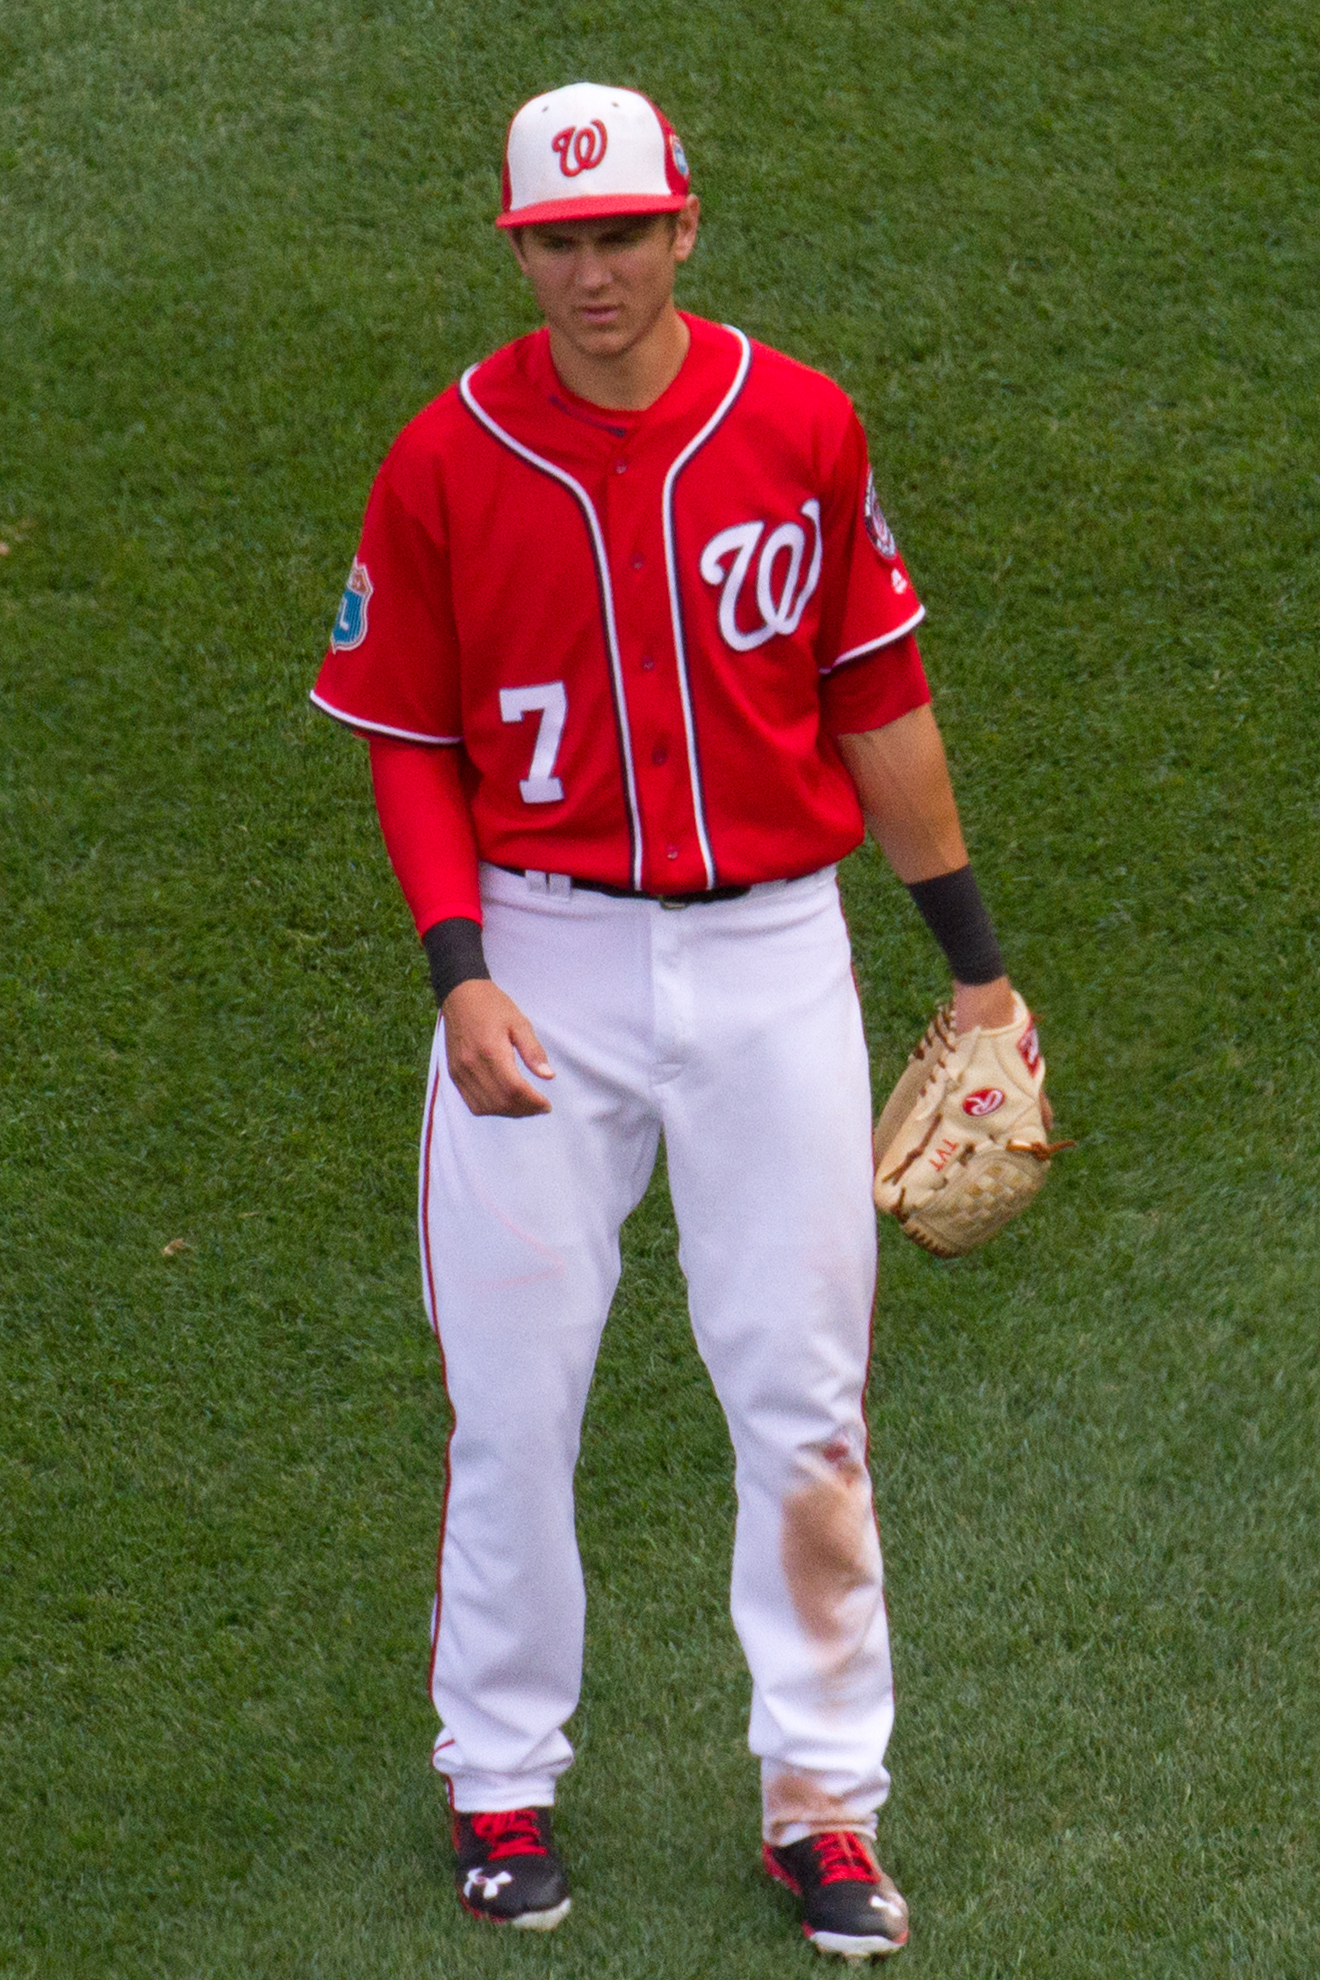
Everybody’s buddy and fine fantasy baseball analyst, Howard Bender, had a piece in the NY Post this week warning about overestimating Turner this year, the way Carlos Correa was overestimated last year.
That’s good advice in general, and probably as it applies to Turner, but it raises the question of how do you draw the line on a young player with a spectacularly good partial season under his belt.
I looked at hitters who had an OPS+ of 130 or better in the year they lost their rookie status since 1980 (the Roto Era), who had 249 plate appearances or more. Sixty one hitters qualified.
Five of those seasons came in 2016. That would be Corey Seager, Aledmys Diaz, Trea Turner, and the Ryans Shrimpf and Healy. One player, Kyle Schwarber, had a qualifying first season and didn’t play the next. That leaves us with 55 hitters in the pool.
What can we learn from them?
If we sort them from top to bottom based on first year OPS+:
 The top 11 had an an OPS+ of 157 in year 1 and an OPS+ of 137 in year 2. Two of this group improved in year two, a man named Trout and another named Greenwell. Three had less than a 130 OPS in year 2: Luke Scott, posterboy Kevin Maas, and Miguel Sano. This group averaged 499 plate appearances.
The next 11 averaged 143 in year 1, and 109 in year 2. One of this cohort, Randy Milligan, improved. Seven had less than a 130 OPS+. Five has less than a 100 OPS+. This group averaged 442 plate appearances.
The middle 11 averaged 137 in year 1, and 116 in year 2. Kris Bryant was the only one to improve. Two were better than 130 in year 2. Only two had less than a 100 OPS+, both at 99, which is why the year 2 average went up for this group. This group averaged 349 plate appearances.
The fourth 11 average 133 in year 1, and 120 in year 2. Ryan Howard and Jason Bay improved. They were also the only two to have an OPS+ the next year better than 130. None of this group has an OPS+ of less than 100. This group averaged 416 plate appearances.
The last quintile averaged 131 in year 1, and 113 in year 2. Josh Hamilton, John Kruk, Lonnie Smith, and Ryan Klesko all improved and had an OPS+ of better than 130. Four hitters had an OPS+ of less than 100. This group averaged 343 plate appearances.
Another way to split these guys into groups would be by plate appearances.
The top quintile averaged 639 plate appearances, with a 151 OPS+ in year 1, and a 137 OPS+ in year 2.
The next group averaged 463 plate appearances, with a 141 OPS+ in year 1, and a 136 in year 2.
The middle quintile averaged 388 PA, with a 138 in year 1, an 85 in year 2.
The fourth group averaged 337 PA, with a 135 in year 1, a 122 in year 2.
The last group averaged just 273 PA, with a 139 in year 1, a 116 in year 2.
All in all, 20 of the 55 players did better than 130 in OPS+ in year 2, 25 did better than 120 OPS+, 33 did better than 110, and 48 did better than 100. That leaves seven true busts, and 30 total who could be considered disappointing.
Eleven of the 20 players who topped 130 in OPS+ had more than 450 plate appearances. Only four of the next 20 players had 450 PA or more.
A final set of ranks, based on percentage of change from year 1 to year 2.
The top quintile averaged 428 plate appearances, posting a 138 OPS+ in year 1, and a 154 in year 2.
The next averaged 508 PA, with 142 in year 1, 131 in year 2.
The middle quintile averaged 415 PA, with a 141 OPS+ in year 1, a 116 in year 2.
The fourth quintile averaged 352 PA, with a 137 OPS+ in year 1, and a 103 in year 2.
The bottom quintile averaged 388 PA, with a 153 OPS+ in year 1, and an 85 in year 2.
Comparing the top half sorted by percentage of change from year 1 to year 2, the top half had 487 plate appearances while the bottom half had 384. The average age of the top half was 23.4 years old, while the bottom half was 24.5. Perhaps not surprisingly, the bottom half hit more homers and stole more bases per plate appearance.
Plate appearances and high OPS+ are the best indicators of a repeat season of top performances for these players, but players of all types do repeat and get better.
So, what happens if we look at only those players with fewer than 450 PA in year 1? There are 37 of them.
Sort them into thirds, and we see that the top two thirds are younger than the bottom third. Older is definitely worse when you’re looking at partial seasons with a high OPS+ in your rookie year. Or maybe it is better put, younger is definitely better.
So, what do we make of this year’s crop?
Corey Seager and Aledmys Diaz should be the most trusted, because they had the most at bats, but neither had a particularly high OPS+ last year, which is a bit of a warning sign. And Diaz is somewhat older, a reason to distrust.
 Trea Turner had the best OPS+ last year, but only 324 plate appearances. Still he’s young, which is a positive sign.
Ryan Shrimpf just snuck onto the list at 130 OPS+. He’s 28 years old, very old, and only had six more PA than Turner. He’s neg all the way.
Finally, Ryon Healy is slightly old, with a 135 OPS+, and only 283 PA. Not as negative as Shrimpf, but not as positive as the other guys.
Bonus No. 1: Kyle Schwarber missed last year, but will be back this year after a powerful world series. He’s still young, but is coming off a 130 OPS+ in 2015. He’s a mixed bag until you see him swing.
Bonus No. 2: Gary Sanchez didn’t make the 250 PA cutoff, but in 229 PA last year he put up a monster 168 OPS+. Only Mike Trout and Jose Abreu did better in our 250+ PA cohort. On the other hand, if you look at the cohort of those who didn’t qualify, the only hitters who did better in year 1 were Frank Thomas and Phil Plantier. Both were 22 their rookie year. Thomas followed up his 177 OPS+ rookie year with a league leading 180 the next year, and then 177, 174, 212, 179, 178, 181 in the next six years. Plantier followed his 178 with a 90 and never topped the 122 he had in year 3.
Finally, what to do with all this? Although there is data here, this sort of study is really anecdotal. The sample is small, the results so various as to mock any absolute conclusions. But maybe you read the above and feel differently.
What I think it tells us is that there are players who post a super first season and then repeat. You can’t rule that out for these guys this season.
But as you would expect, extreme performance usually regresses to the mean, so you should not count on a repeat. And you should fear charging ahead taking anyone with such a small performance sample, because the possibility of sophomore slump is always there (except for Corey Seager, right?).
Which is pretty dull and which brings us to Howard’s comment about Trea Turner. He says, “Of course Turner is a great talent, but just doubling his total because he will get twice the at-bats this year is not the proper way to project.”
The trouble with Turner is that even if you regress back his stats you end up with ridiculous numbers. My projection, which doesn’t come close to doubling last year’s numbers is 18 homers, with 49 steals, a modest 93 runs and 68 RBI, with a .307 batting average. In 5×5, that’s worth $37. First-round value.
ZIPS chops more aggressively. It gives Turner 260 more plate appearances than last year and one more homer, three more steals, a .282 batting average and modest 77/66 runs and RBI split. But even that modest projection is worth $29, which is a Top 15 hitter.
Is my projection the median projection? Is ZIPS’? That’s the trouble with Turner. Right now I have him with an NL-only bid price of $27. That’s not going to get him, and paying more isn’t necessarily going to hurt the team that buys him.
So, what you do is you keep bidding. Certainly to $27, maybe to $30. This is a place to read the room. Once you’re at $30 you don’t really want him, but the risk of bidding up the guy who does really want him isn’t huge. I mean, you might end up with Trea Turner!
At that price, that could be trouble, but might not.
Here’s a link to the data, both that which I used and that which I didn’t.
 The software is out now, full of projections, bid prices, expert league results, and prospect lists, in Windows software, Excel and Text Files.
It runs great on a Mac with Windows and Boot Camp, Parallels, or Fusion. If you want help preparing for your league, learn more about Patton $ Software and data by clicking here.
And joining Pattonandco.com, a lively discussion board about fantasy and real baseball, is free!
Which pitcher earned the most in the season’s first four weeks? Dallas Keuchel earned $40.
 Which pitcher who wasn’t bought was earning the most after four weeks? Nick Martinez earned $24.
Our best hitter the first four weeks? Nelson Cruz earned $51.
And Tim Beckham is the undrafted hitter who is earning the most, with $12.
Each month we publish the 5×5 roto prices, along with a listing of what these player’s cost on auction day, so you can judge how players are performing versus expectations. This month we let the stats run into May a bit because of the late start to the season.
These are 5×5 stats based on a 24-team mixed league, so AL or NL peculiarities are ignored. This makes the prices a little less exact, because league context does affect them, but the differences are small and complicate issues significantly.
You can find the spreadsheet here on Google Docs.
I received the following in email earlier today. It is a computer generated analysis of the Mock I did for Baseball Prospectus earlier this week. I can’t contest the wisdom of the machine, which will someday replace the fantasy experts at CBSsports, at least. I apparently have a terrible team. But its writing is dismal.
I do hope they send out a story after the season, showing how these teams actually did, and how good or bad their analysis actually was.
Draft Recap
By CBSsports Interactive

The final victory is still up for grabs, but Brian Walton have taken a good first step, winding up with the top ranked draft. Coach Walton’s squad, led by Jose Altuve, are projected to wind up with 120 category points. That’s 55 more points than you are projected to come up with. You will have all year to prove us wrong, but for now, you are slated to finish in last place.
Bret Sayre are expected to be better than that overall, and much better on the outfielders front, where they have the best group in the league. Coach Sayre can trot out Andrew McCutchen, Michael Brantley, and George Springer into the starting lineup. Steve, meanwhile, are the worst in the league in that area, with Allen Craig, Melvin Upton, and Drew Stubbs gracing the starting lineup. Coach Moyer won’t be able to blame outside factors for that soft spot in the roster either, given that they had the 2nd easiest path through the draft.
Speaking of draft difficulty, you had it pretty rough, as you ended up with less value available to you than all but two other teams. You had to watch as good value picks like David Price, J.D. Martinez, and Dallas Keuchel were snatched right before it was your turn.
Turning to individual picks, we tapped Steve as having made the best pickup with Cliff Lee in the 169th slot. He was projected to be off the board a full 85 picks earlier. On the other hand, Fake Teams made the worst move of the draft. Coach Guilfoyle selected Starlin Castro with the 57th pick, which we pegged as a serious reach.
Your best pickup of the draft was Corey Kluber, who was expected to have been selected in the 25th slot, but who you got with pick #39. However, you mixed in some duds as well, the worst of whom was Daniel Murphy, taken 74 spots ahead of what his average draft position suggests.
|
Teams |
|
|
Team |
Projected Category Points |
|
Brian Walton |
120 |
|
Bret Sayre |
95 |
|
Lawr Michaels |
94 |
|
Lamentation of Their Women |
84 |
|
Gardner |
82 |
|
Team McLeod |
79 |
|
Steve |
77 |
|
Matthew Pouliot |
75 |
|
Tim Heaney |
75 |
|
Mike Gianella |
74 |
|
Walter Kuberski |
72 |
|
Ryan Bloomfield |
71 |
|
Fake Teams |
69 |
|
Asches to Asches, Cust to Cust |
68 |
|
Rotoman’s Vertigos |
65 |
|
Players Drafted |
|||
|
Player |
Pick Number |
Average Draft Position |
Pick Value Rank |
|
9 |
7 |
99 |
|
|
22 |
37 |
328 |
|
|
39 |
25 |
26 |
|
|
52 |
64 |
307 |
|
|
69 |
114 |
340 |
|
|
82 |
156 |
343 |
|
|
99 |
115 |
302 |
|
|
112 |
104 |
79 |
|
|
129 |
185 |
333 |
|
|
142 |
126 |
63 |
|
|
159 |
183 |
292 |
|
|
172 |
201 |
291 |
|
|
189 |
228 |
286 |
|
|
202 |
206 |
218 |
|
|
219 |
203 |
96 |
|
|
232 |
240 |
212 |
|
|
249 |
307 |
243 |
|
|
262 |
215 |
75 |
|
|
279 |
293 |
188 |
|
|
292 |
279 |
148 |
|
|
309 |
287 |
146 |
|
|
322 |
289 |
137 |
|
|
339 |
346 |
152 |
|
Testing the link creation in Twitter and Facebook from the Ask Rotoman Blog.